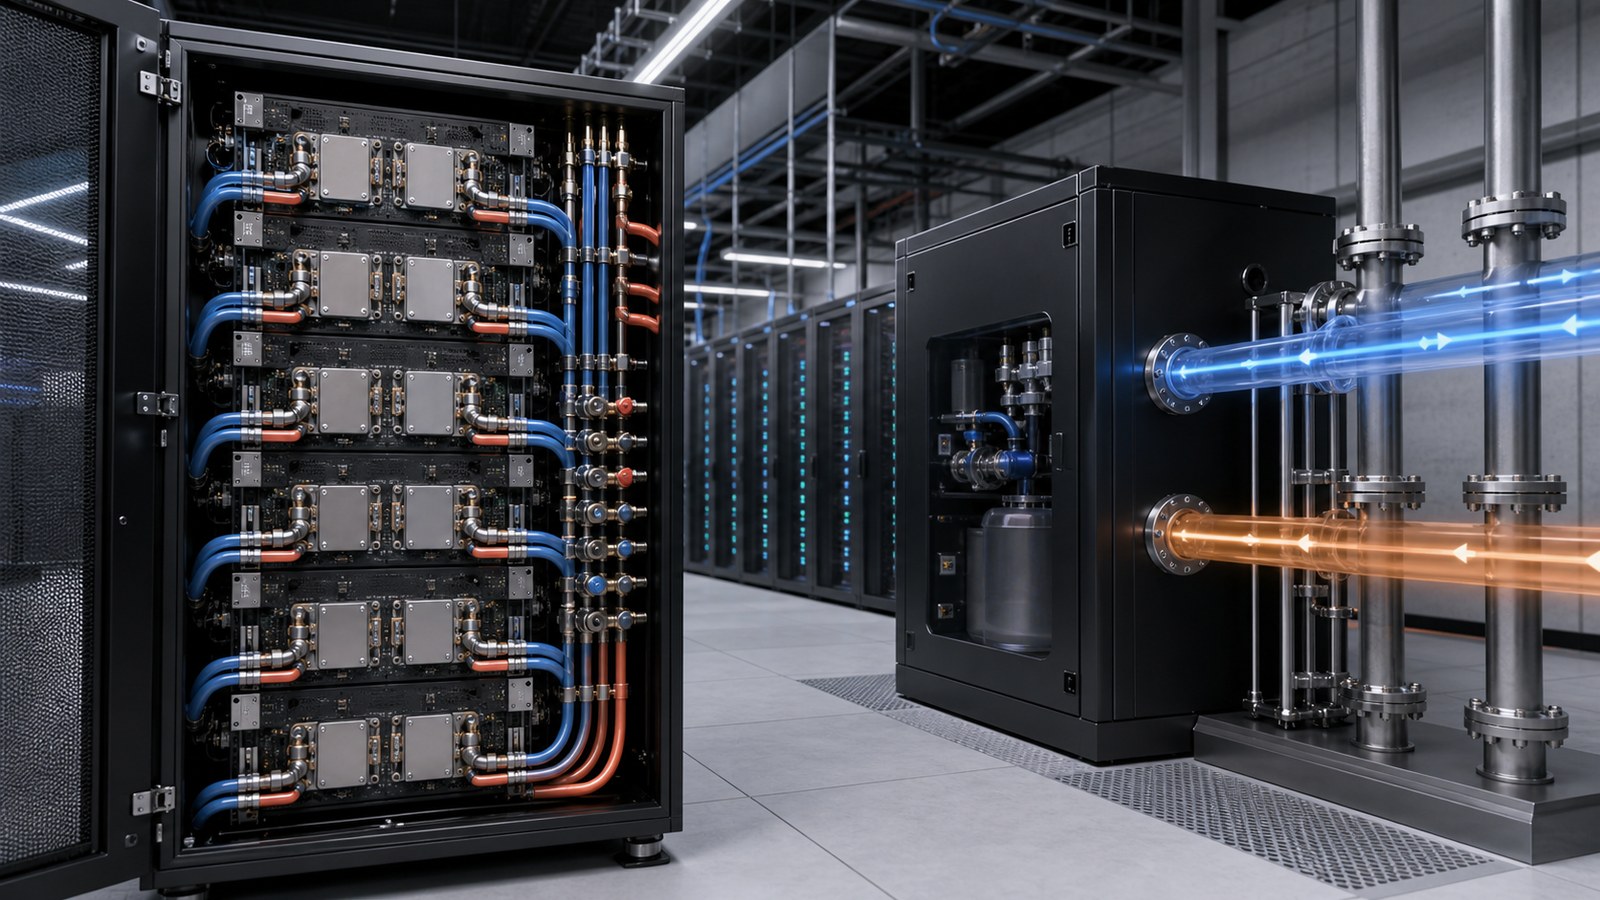
Data center liquid cooling animation shows how heat travels from high-density processors into cold plates or another liquid interface, through server and rack distribution, across a coolant distribution unit, and into the facility heat-rejection system. By placing the IT equipment and mechanical infrastructure in one time-based view, it helps owners, designers, operators, customers, and technicians understand a system that is otherwise divided among diagrams, specifications, controls screens, and separate rooms.
The most useful visual does more than color one pipe blue and another red. It identifies loop boundaries, supply and return direction, temperature and pressure relationships, residual air-cooling loads, isolation points, redundancy, control states, and what changes during startup, maintenance, loss of flow, or a leak alarm. The client’s approved design and operating procedures remain authoritative.
Contact us at info@austinvisuals.com or call (512) 591-8024.
What Is Data Center Liquid Cooling Animation?
Data center liquid cooling animation is a 2D or 3D technical visualization of the equipment, fluid loops, heat-transfer path, controls, and operating states used to cool high-density information technology equipment. It may focus on a single server tray, one rack and CDU, a full data hall, or the connection from chips to the central plant and outdoor heat rejection.
An AI data center cooling animation can be created for a proposed design, a retrofit, a vendor solution, an installation sequence, a commissioning program, or an operating procedure. It can also combine a realistic 3D environment with simplified overlays so viewers see both where equipment sits and what the coolant, heat, sensor, and control states are doing.
ASHRAE’s current AI Data Center Energy Performance Framework identifies direct-to-chip cooling as an emerging standard for high-performance computing infrastructure. Open Compute Project guidance treats the technology cooling system, facility water system, piping routes, CDU location, redundancy, isolation, and commissioning as one integrated planning problem. Animation is valuable because it can preserve those boundaries while showing their interaction.
How Does Heat Move Through a Direct-to-Chip Cooling System?
1. Heat Leaves the Processor Through a Cold Plate
A cold plate is mounted to a high-heat component such as a GPU or CPU through a defined mechanical and thermal interface. Coolant passes through internal channels, absorbs heat, and exits at a higher temperature. A direct-to-chip cooling animation can reveal this hidden path without implying that coolant contacts the silicon directly.
The visual should respect component spacing, cold-plate contact, tubing bend radius, connector orientation, and flow arrangement. Decorative liquid waves moving across the motherboard may look impressive but teach the wrong system.
2. Server Tubing Connects to the Rack Manifold
Flexible hoses and quick disconnects carry supply and return fluid between the server and a rack or row manifold. The manifold distributes flow across multiple trays or nodes. A useful animation can isolate one branch, then zoom out to show how parallel loads affect the total rack flow and heat load.
Open Compute Project cold-plate guidance includes quick disconnects, tubing, manifolds, leak detection, a secondary cooling loop, a CDU, the facility water system, and heat rejection as connected parts of the technology cooling system. Those elements should not be collapsed into one fictional loop.
3. The Coolant Distribution Unit Controls the Secondary Loop
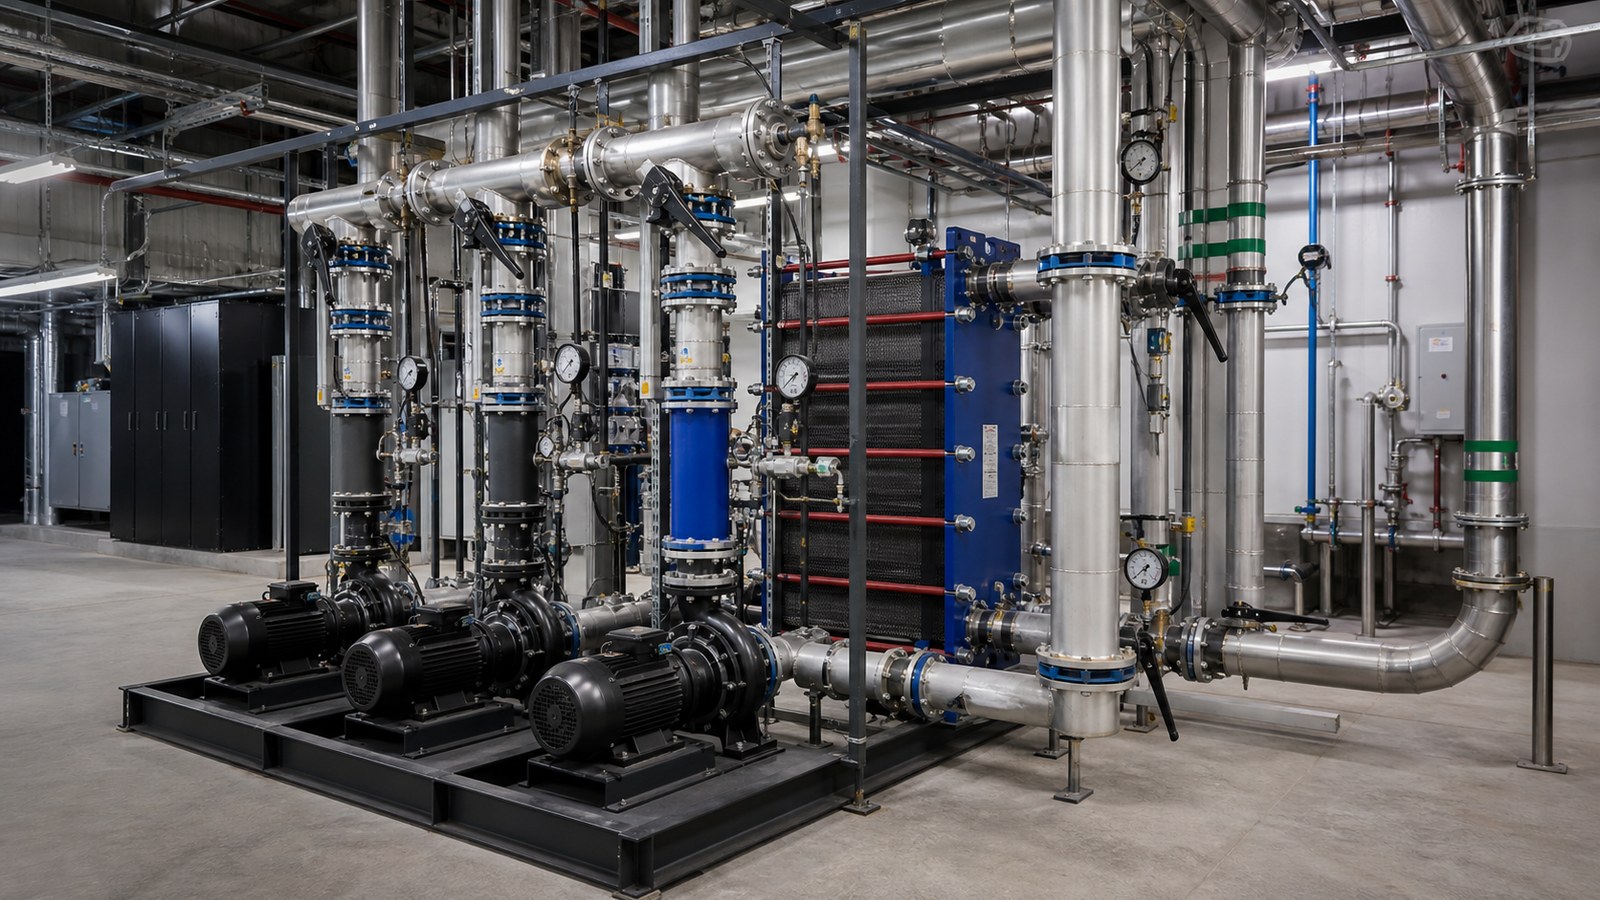
The CDU circulates and conditions coolant for the IT equipment. Depending on the architecture, it may include pumps, a heat exchanger, controls, filtration, expansion volume, sensors, alarms, and isolation valves. It transfers heat from the technology cooling system to a facility-side medium without mixing the two fluids in a conventional liquid-to-liquid arrangement.
A coolant distribution unit animation can show the physical separation between loops while synchronizing temperature, pressure, flow, pump status, valve position, and load. It should also identify whether the CDU is in-rack, in-row, or serving multiple racks because location changes the piping and maintenance story.
4. Facility Infrastructure Rejects or Reuses the Heat
From the CDU, the facility loop may connect to chilled water, dry coolers, cooling towers, refrigerant-based equipment, or another heat-rejection architecture. Supply temperature, climate, water strategy, required approach temperatures, redundancy, and existing infrastructure influence the selection.
Warm-water designs may increase opportunities for economization or heat reuse, but animation should not promise a universal energy or water outcome. Those results depend on climate, controls, operating temperatures, plant efficiency, load, and the complete system boundary being evaluated.
How Is Direct-to-Chip Different From Immersion or Rear-Door Cooling?
Direct-to-chip cooling routes coolant through cold plates attached to selected high-heat components. It can support high rack densities while preserving familiar server and rack service models. However, components not served by cold plates may still reject heat to air.
Immersion cooling places IT equipment in a tank of dielectric fluid. Single-phase systems circulate liquid without boiling; two-phase systems use a working fluid that changes phase and condenses. The tank, service procedures, fluid handling, material compatibility, and heat-rejection path differ substantially from cold-plate systems.
Rear-door heat exchangers remove heat from rack exhaust through a liquid-cooled door. They can reduce the load released into the room while leaving server airflow largely intact. Some facilities combine rear-door and direct-to-chip approaches.
A decision animation should not present these methods as cosmetic alternatives. It should compare which heat sources each method captures, what remains for room cooling, how equipment is serviced, where fluid is present, and how the solution connects to facility infrastructure.
Why Do Liquid-Cooled Racks Still Need Airflow?
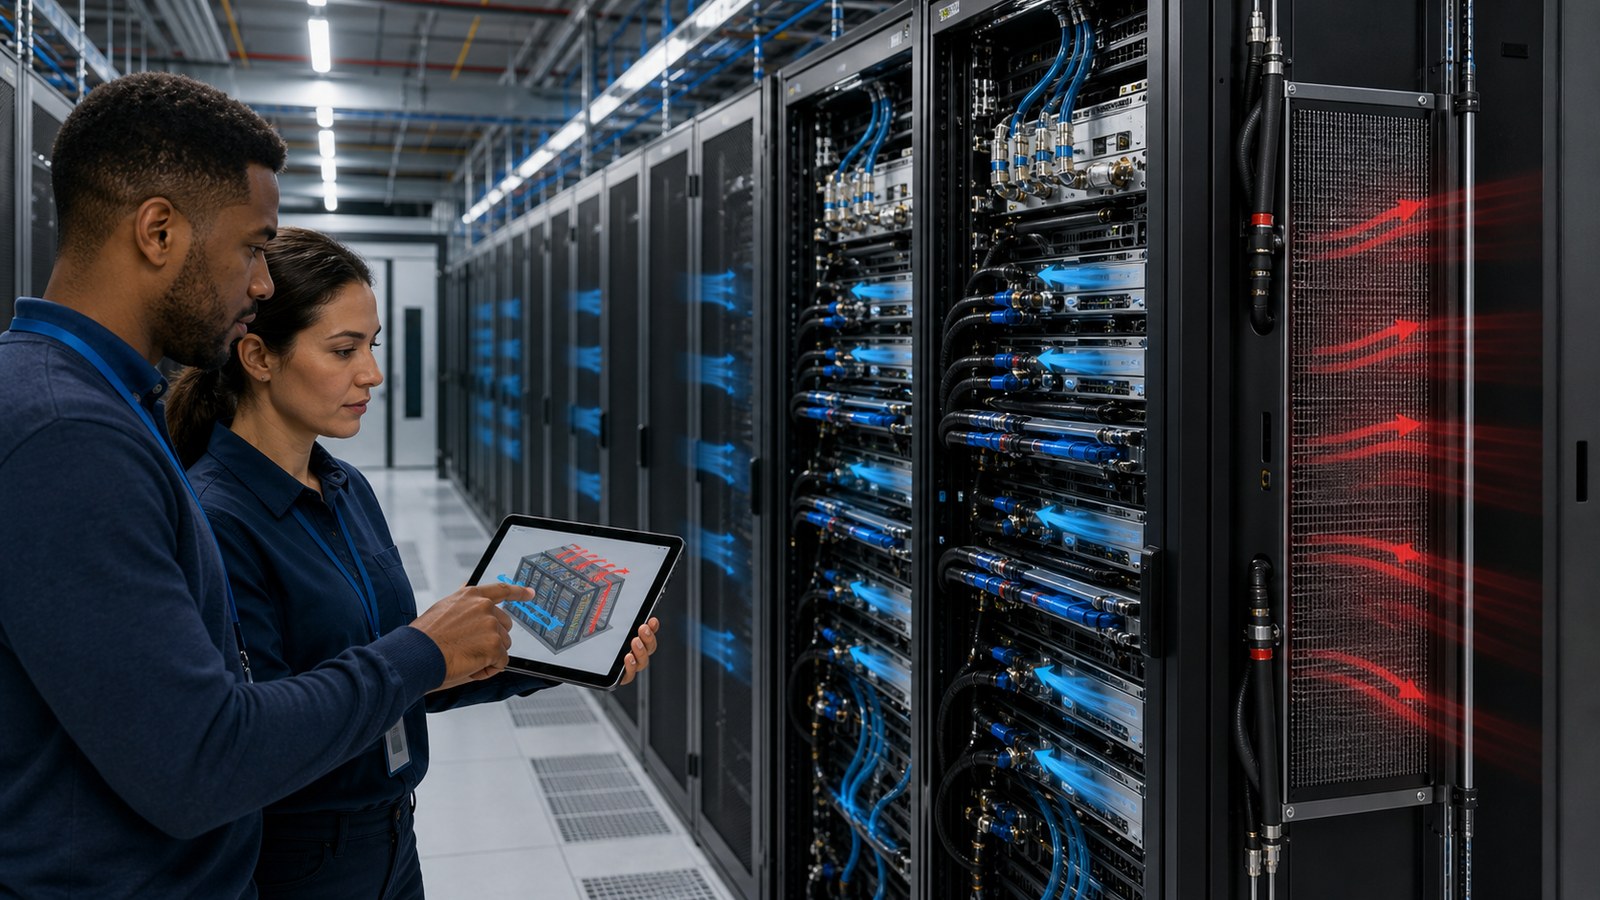
Many current high-density systems use hybrid cooling. Cold plates remove heat from processors and other targeted devices, while memory, power supplies, storage, networking, voltage regulation, or other components may still rely partly on airflow. NVIDIA’s published DGX SuperPOD architecture, for example, describes hybrid direct-liquid and air cooling for GB200 racks.
A liquid-cooled server animation should therefore include the residual air path when it exists. Removing every fan, aisle, and room-cooling element from the visual can give operators a false impression of the thermal design. The animation may show the percentage or heat load assigned to each path only when those values come from approved equipment and design data.
Hybrid visualization also helps teams coordinate containment, rear-door exchangers, CRAH or fan-wall capacity, rack placement, and controls. Austin Visuals’ guide to data center airflow animation covers the air side in greater detail.
What Should a High-Density Rack Cooling Visualization Include?
A useful high-density rack cooling visualization begins with the actual operating question. A design-coordination visual may emphasize pipe routing, floor or overhead distribution, CDU access, clearances, and phased capacity. An operator module may emphasize valves, sensors, alarms, pump states, leak zones, and recovery steps. A sales visual may simplify the same architecture while retaining honest loop boundaries.
Common visual layers include:
- GPU, CPU, memory, networking, and power heat sources
- Cold plates, hoses, quick disconnects, and rack manifolds
- Technology cooling system supply and return
- CDU pumps, heat exchanger, filtration, expansion, sensors, and controls
- Facility water or refrigerant-side connections
- Residual rack and room airflow
- Isolation boundaries, redundancy, bypasses, and maintenance access
- Heat rejection, economization, or approved heat-reuse interface
The visual does not need to display every layer simultaneously. Camera movement, transparency, restrained color, and progressive disclosure can preserve orientation while focusing each section on one decision.
Which Operating States Are Most Important to Animate?
Normal Operation and Load Change
Start with a credible baseline. Show stable supply temperature, return temperature, flow, pressure, pump state, and residual airflow before compute load changes. The animation can then show how control setpoints and equipment respond, using client-approved relationships rather than invented dashboard behavior.
Startup, Fill, Purge, and Commissioning
Commissioning involves more than turning on a pump. Teams may need to verify cleanliness, fluid compatibility, fill and purge air, establish pressure, balance branches, test sensors, confirm alarms, exercise valves, prove redundancy, and document acceptance criteria. The exact sequence belongs to the equipment manufacturer, engineer, commissioning authority, and operator.
Maintenance Isolation and Service
A maintenance animation can show how one rack, branch, CDU, or pump is isolated while required cooling remains available elsewhere. It can identify the expected state of valves, connectors, alarms, and redundant equipment without becoming an unofficial operating procedure.
Loss of Flow, High Temperature, and Leak Detection
Failure-state animation can synchronize the initiating condition with sensor response, control action, workload response, operator notification, and escalation. Leak detection should be placed where the actual design provides it, such as around connectors, tubing, cold plates, manifolds, or containment zones.
How Can Animation Support Design, Training, and Sales?
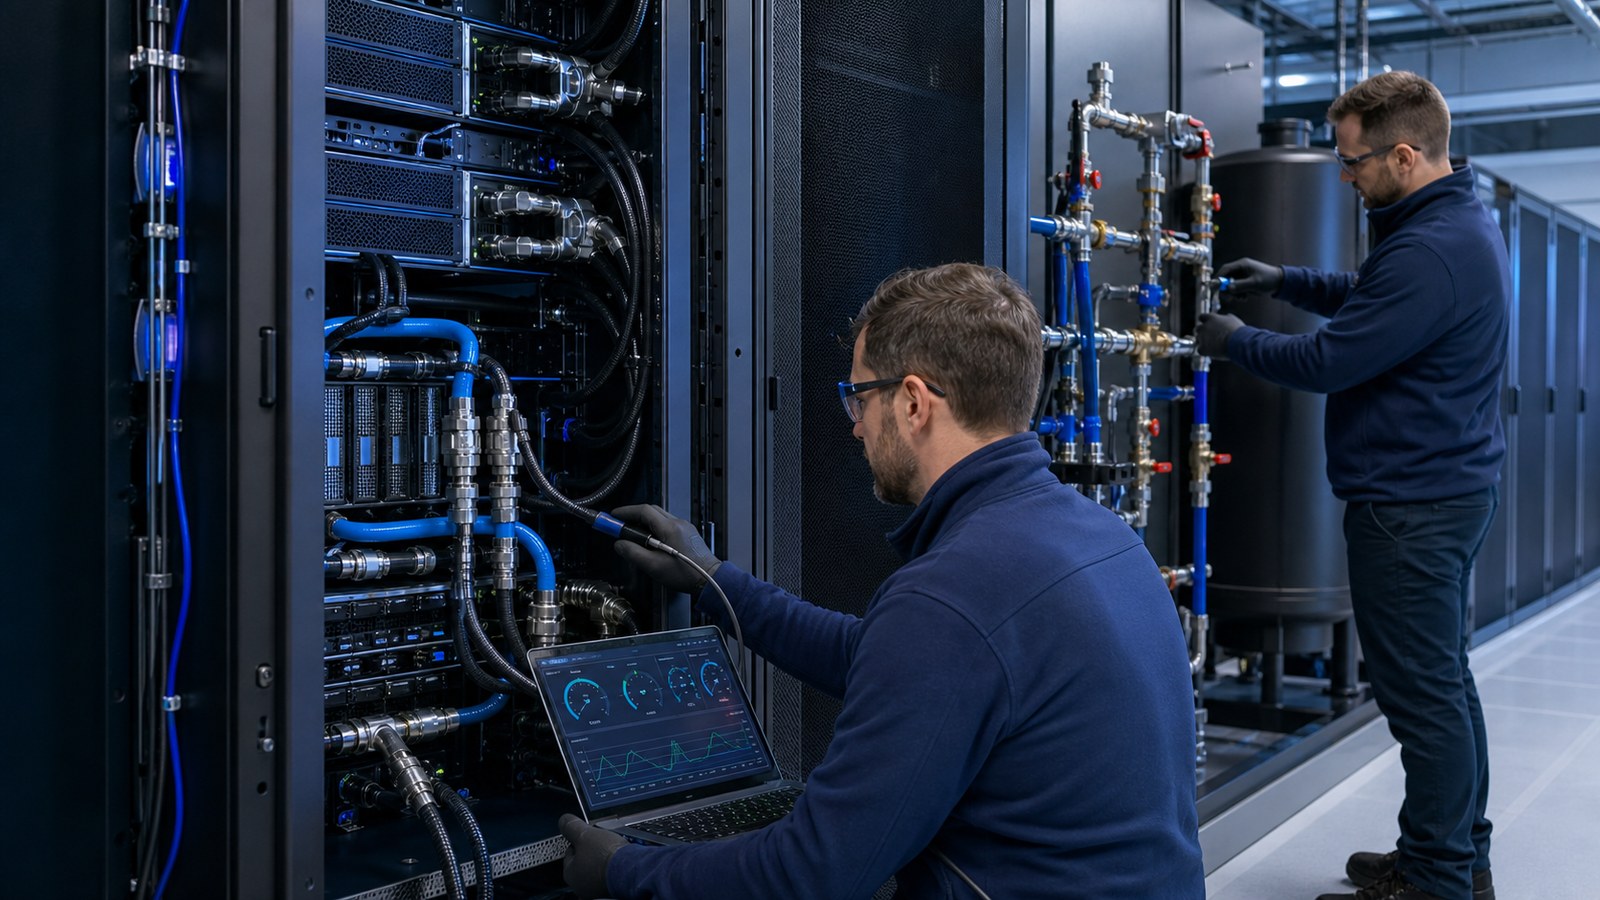
Design teams can use animation to review how rack layouts, piping routes, CDU locations, maintenance clearances, and phased capacity fit together. Construction and commissioning teams can preview sequence, access, fill, purge, balancing, testing, and turnover requirements.
Operations teams can study normal states, alarms, isolation, redundancy, and the relationship between IT telemetry and mechanical systems. Customers and executives can see why liquid cooling changes power density, space, infrastructure, and deployment planning without reading every technical drawing.
Manufacturers and integrators can use the same approved 3D asset system for product launches, installation guidance, service training, trade-show loops, and sales conversations. The narration and level of detail should change by audience, while the underlying geometry and system logic remain consistent.
How Is a Technically Accurate Cooling Animation Produced?
1. Define the System Boundary
Decide whether the animation ends at the server, rack, CDU, facility loop, or heat-rejection plant. Record which equipment is exact, representative, or intentionally omitted. This prevents a server-focused visual from quietly making claims about the central plant.
2. Gather Controlled References
Useful inputs include BIM, P&IDs, mechanical plans, rack elevations, server and CDU drawings, equipment data sheets, controls narratives, sequence-of-operations documents, commissioning scripts, sensor lists, fluid specifications, and approved performance points. Record revision dates and source owners.
3. Build a Heat-and-Control Map
For each scene, identify heat source, coolant path, loop boundary, equipment state, sensor, control response, air-side remainder, and reviewer. The map keeps the animation from becoming a beautiful pipe tour with no operational meaning.
4. Approve the Animatic Before Final Rendering
A low-detail animatic establishes camera positions, timing, overlays, transitions, and operating-state changes. IT, mechanical, controls, commissioning, and operations reviewers can correct the logic while revisions remain efficient.
How Much Does Data Center Liquid Cooling Animation Cost?
Cost depends on the system boundary, quality of BIM and CAD, number of racks and equipment types, required operating states, control overlays, runtime, technical-review burden, narration, languages, and derivative formats. A focused 2D loop explanation can require a smaller investment than a detailed 3D data hall with several CDU architectures and commissioning scenarios.
A useful proposal separates technical intake, script, storyboard, model preparation, animatic, engineering reviews, final animation, voice, captions, revisions, and alternate edits. Buyers should also define ownership of models and whether future rack generations, capacity phases, or training modules will reuse the assets.
Why Choose Austin Visuals to Work With?

Austin Visuals builds technical animation around the client’s system boundary and approval structure. For liquid cooling, that means showing the heat path and loop interfaces clearly while separating exact project geometry from representative equipment and educational simplification.
The studio can combine BIM and CAD preparation, rack and mechanical-room modeling, transparent cutaways, flow and heat overlays, controls graphics, narration, captions, and role-specific edits. Review gates can be assigned to IT, mechanical, controls, commissioning, safety, operations, and product stakeholders before final rendering.
Austin Visuals also produces content for connected infrastructure decisions, including data center power redundancy animation and data center construction phasing animation. Together, these assets can form a consistent visual library for design, construction, commissioning, operations, and customer education.
Our Clients include:

Conclusion
Data center liquid cooling animation is most valuable when it follows heat all the way through the approved system boundary. It can connect processors, cold plates, connectors, manifolds, CDUs, facility loops, residual airflow, controls, and heat rejection in a way that static documents rarely achieve alone.
The production should begin with controlled references, distinguish loop boundaries, preserve hybrid cooling, and show operating states rather than a single idealized flow. With those safeguards, one reviewed visual model can support planning, commissioning, training, sales, and future capacity discussions.
Contact us at info@austinvisuals.com or call (512) 591-8024.
Frequently Asked Questions
What is data center liquid cooling animation?
It is a 2D or 3D technical visual that explains how liquid captures heat from IT equipment, moves through rack distribution and a CDU, and transfers that heat to facility infrastructure.
How does direct-to-chip liquid cooling work?
Cold plates attached to high-heat components absorb heat into circulating coolant. Server hoses and rack manifolds carry the warmed fluid to a CDU, which transfers the heat to another cooling loop.
What is the difference between direct-to-chip and immersion cooling?
Direct-to-chip systems circulate fluid through contained cold plates attached to selected components. Immersion systems place compatible IT equipment directly in a dielectric fluid tank.
What does a coolant distribution unit do?
A CDU circulates and conditions the technology-side coolant and transfers heat to a facility-side medium. It may also provide pumping, filtration, expansion, sensing, alarms, and controls.
Do liquid-cooled data centers still need air cooling?
Often, yes. Components not connected to cold plates may still release heat to air, so hybrid rack airflow, containment, and room cooling can remain part of the design.
Can animation be used for liquid-cooling commissioning training?
Yes. It can support explanations of fill, purge, balancing, sensor checks, alarm tests, redundancy, isolation, leak detection, and turnover when it follows approved procedures and equipment guidance.
What source files are needed for a liquid-cooling animation?
Useful inputs include BIM, P&IDs, rack elevations, equipment CAD, CDU and server data sheets, controls narratives, commissioning plans, sensor lists, fluid specifications, and designated technical reviewers.