
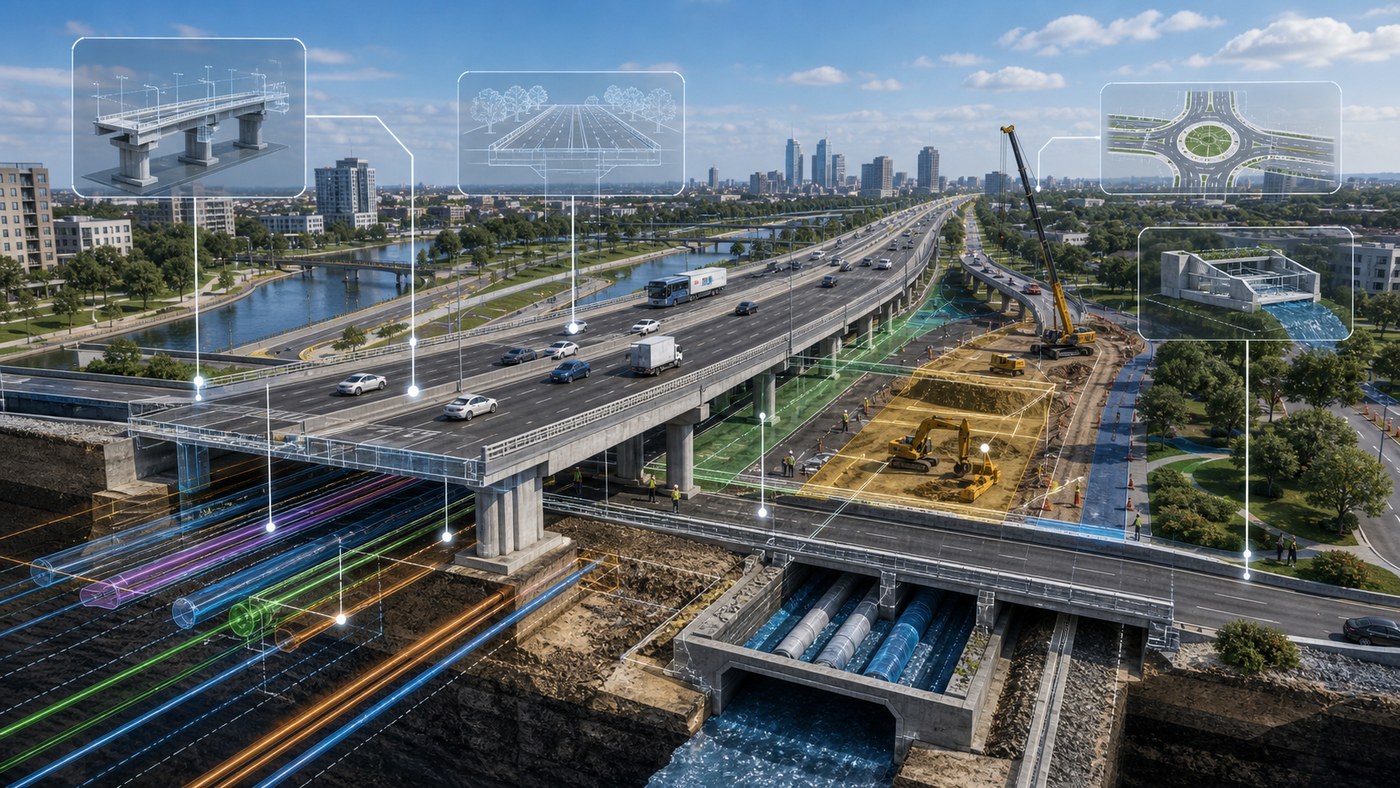
Civil and infrastructure projects are difficult to explain because they involve scale, phasing, technical constraints, public impact, and many stakeholders. A roadway expansion, bridge replacement, drainage system, transit facility, utility corridor, airport improvement, water treatment upgrade, or mixed-use infrastructure plan may be clear to engineers, but less obvious to decision-makers, community members, contractors, and funding partners. Engineering visualization for civil projects turns complex plans into visual communication people can understand.
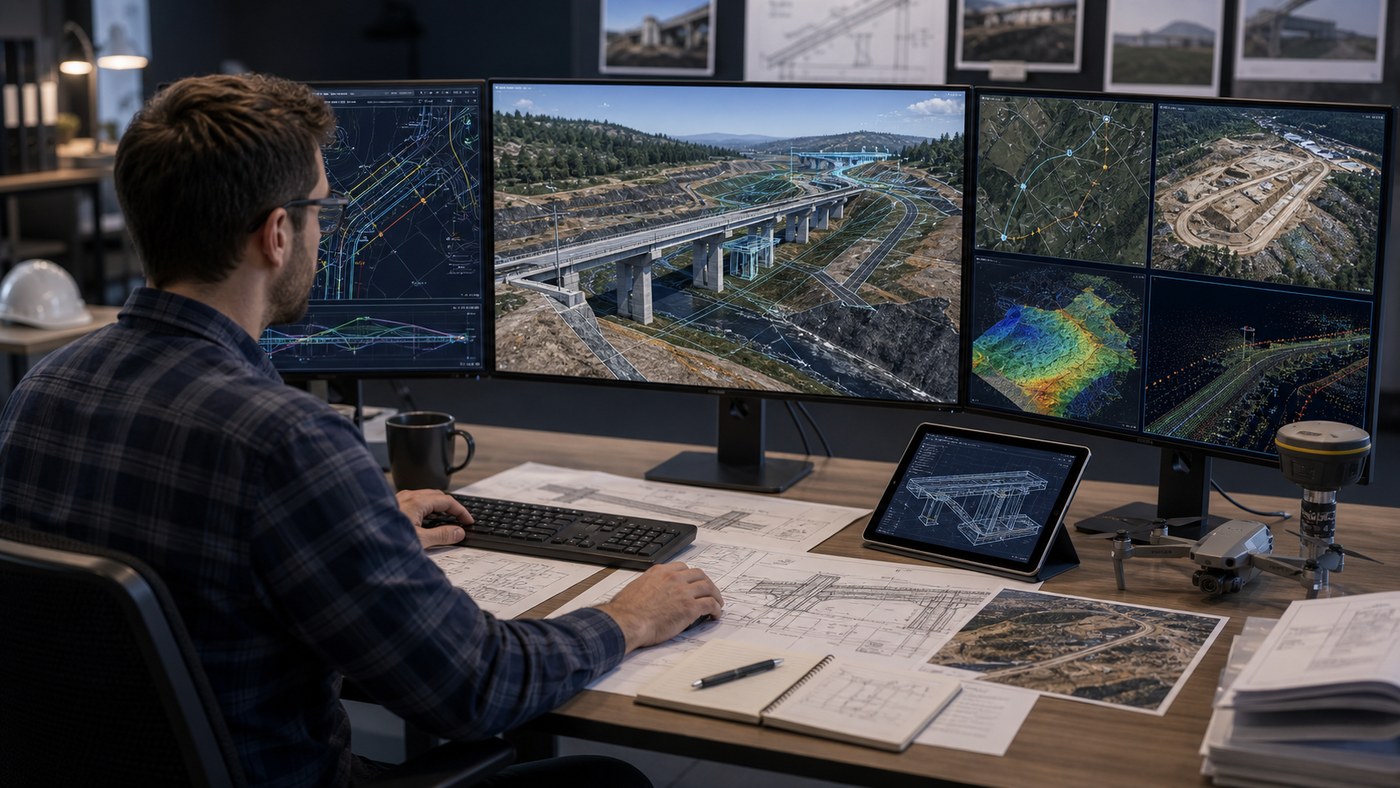
Austin Visuals helps technical teams translate drawings, CAD files, survey references, schedules, and design concepts into clear visual assets. For civil projects, that may include 3D site visualization, construction sequencing, public meeting videos, proposal visuals, stakeholder presentations, safety training, and animation that explains how a project will be built or operated. The goal is not to replace engineering documents. The goal is to make those documents easier to discuss.
If your civil engineering project needs to be seen clearly before it is built, Austin Visuals can help. Email info@austinvisuals.com or call (512) 591-8024 to discuss engineering visualization, 3D animation, or infrastructure presentation visuals.
What Engineering Visualization Means for Civil Projects
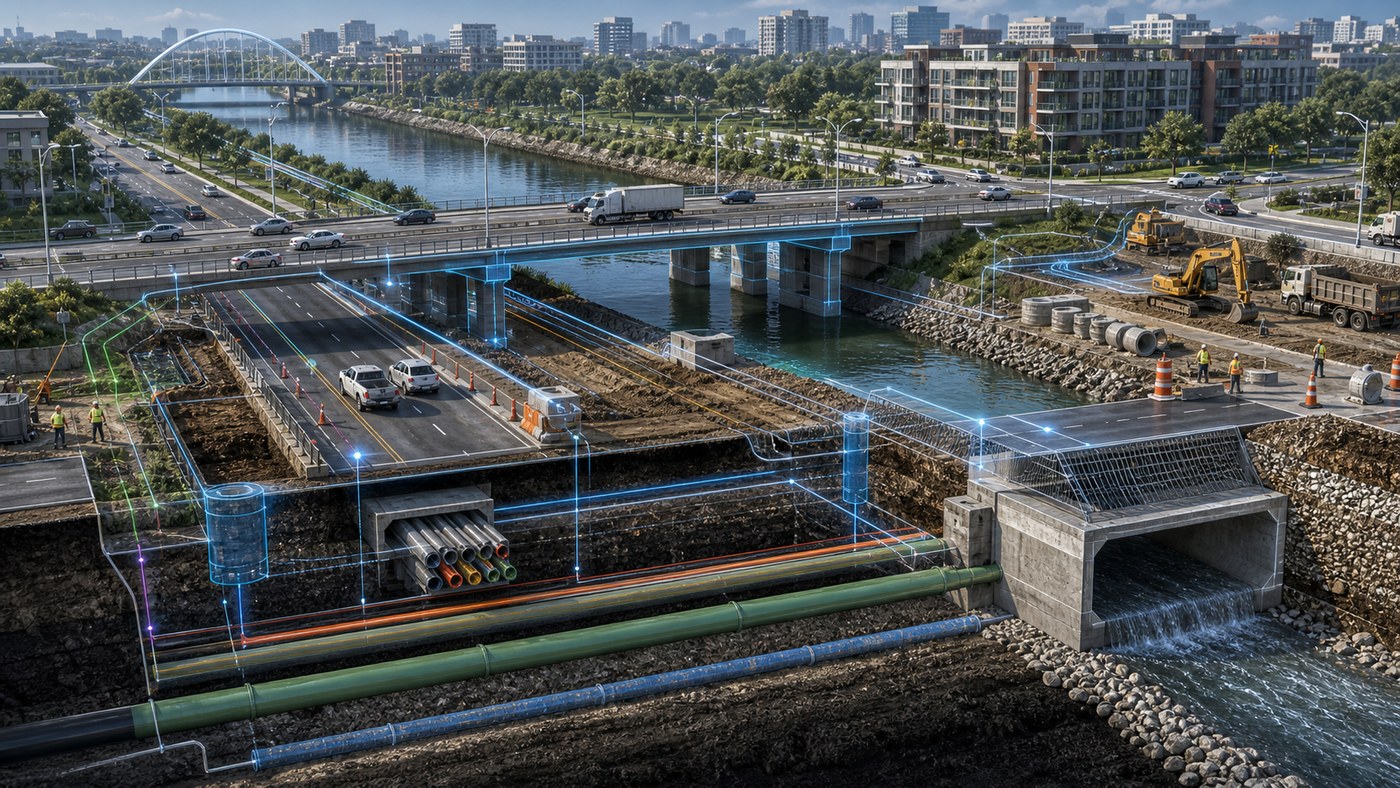
Engineering visualization for civil projects is the use of 3D models, animation, motion graphics, renderings, diagrams, and visual storytelling to explain infrastructure design and construction. It can show how a project will look, how it will function, how it will be built, and how it will affect the surrounding environment.
This type of visualization is useful because civil projects are spatial and sequential. A plan set may show geometry, grading, alignments, utilities, structures, drainage, staging, and traffic control, but not always in a way that non-engineers can interpret quickly. Visualization gives the viewer a guided path through the project.
A 3D model can show existing conditions, proposed design, construction phasing, temporary access, detours, equipment zones, public-facing improvements, and final conditions. Animation can move through the site, highlight key changes, and show how a project evolves over time. This helps stakeholders understand both the design and the process.
Austin Visuals has covered related needs in the importance of engineering-grade 3D visualization in modern industry. Civil projects benefit from the same principle: technical accuracy becomes more useful when people can see and discuss it clearly.
Why Civil Engineering Projects Need Visual Communication
Civil projects often involve audiences with different levels of technical knowledge. Engineers, contractors, public agencies, elected officials, developers, property owners, residents, utilities, emergency services, and investors may all need to understand the project. Each group asks different questions. How will traffic move? Where will drainage go? What will construction disrupt? What will the final improvement look like? How long will each phase take?
Engineering drawings are essential for design and construction, but they may not answer those questions clearly for every audience. A resident may not understand a plan sheet. A funding committee may not have time to review a full technical package. A contractor may need to see how staging affects access. A 3D visualization can help each group see the project in context.
Visual communication also reduces ambiguity. If stakeholders imagine different versions of the same project, conversations become harder. A visual model creates a shared reference point. People can point to the same bridge, lane, building, utility corridor, or work zone and discuss it more clearly.
This is especially important when a project affects public space. Roads, bridges, water systems, parks, transit stations, utility corridors, and civic facilities are not abstract assets. People use them every day. Visualization helps teams communicate impact, benefits, and construction sequence with more transparency.
3D Visualization for Infrastructure Proposals
Infrastructure proposals often need to persuade evaluators before a project is fully understood. A proposal team may have strong engineering, but if the reviewer cannot quickly see the approach, the value may be missed. 3D visualization can help make the proposal clearer and more memorable.
For government contracts, public-private partnerships, design-build pursuits, and major civil bids, visualization can show the team’s understanding of the site and the solution. It can explain constructability, phasing, traffic management, access, risk reduction, and final outcomes. A strong visual can communicate in seconds what might take pages to describe.
This does not mean the visual should replace technical substance. It should support it. The best proposal visuals are accurate enough to build confidence and clear enough to guide the reviewer. They show the project logic without overwhelming the audience.
Austin Visuals has discussed this in how 3D animation wins government contracts. Infrastructure proposals are competitive, and visualization can help teams show their plan with greater clarity.
Construction Phasing and Sequencing Animation
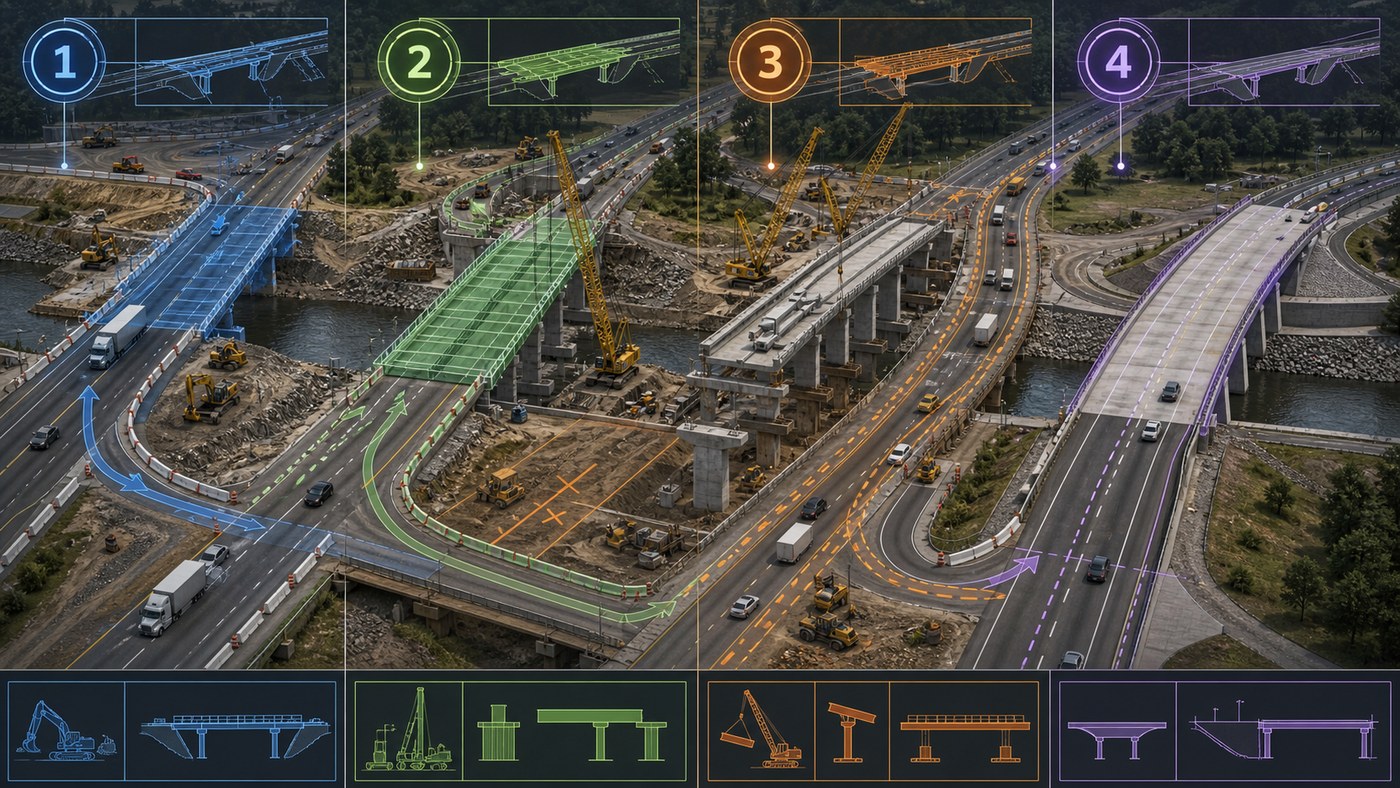
Construction phasing is one of the strongest uses of engineering visualization for civil projects. Many infrastructure projects cannot be built all at once. Traffic must keep moving, utilities may need to remain active, businesses need access, and safety zones must be maintained. Animation can show how the project progresses over time.
A phasing animation can begin with existing conditions, then show each stage of work. It can highlight demolition, temporary lanes, detours, utility relocation, foundation work, structure placement, pavement work, drainage installation, landscaping, and final opening. This helps teams see how construction decisions affect real-world movement.
For contractors and owners, sequencing visualization can support planning meetings, stakeholder briefings, safety discussions, and public outreach. It can help identify conflicts earlier because the sequence is easier to understand visually. If a lane closure, crane location, or access route creates a problem, the team may catch it before construction begins.
For public audiences, phasing animation can reduce frustration. People are more patient when they understand what is happening, why it is happening, and when conditions will change. A clear visual explanation can make a complicated schedule easier to accept.
Visualization for Public Meetings and Community Outreach
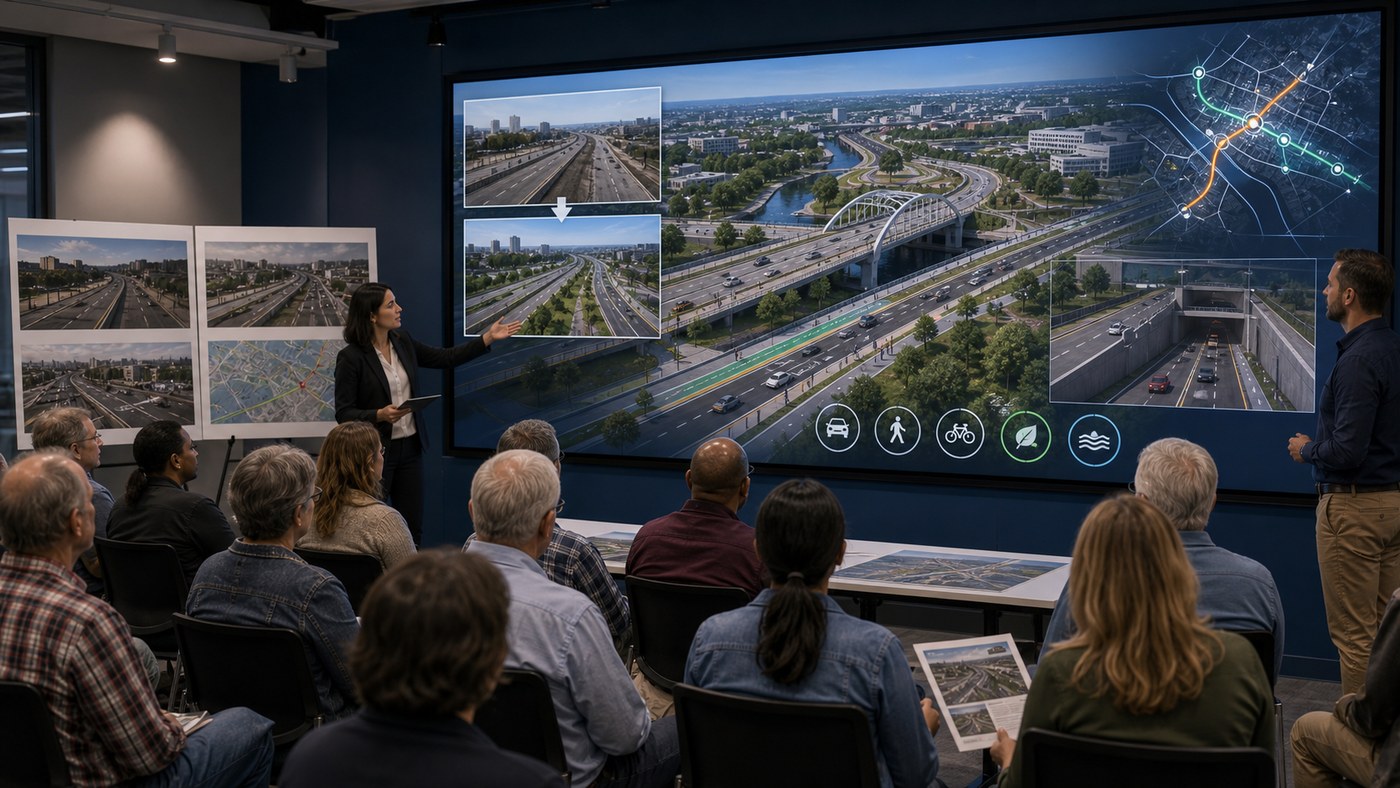
Public meetings can be difficult when the project is technical. Community members may have valid concerns about traffic, noise, access, safety, drainage, appearance, environmental impact, or construction duration. A clear visualization gives the project team a better way to explain what is proposed and what will change.
Before-and-after visuals are especially useful. They can show existing conditions next to proposed improvements, making the benefits more concrete. Animated flythroughs can show how a corridor will feel from a driver’s, cyclist’s, pedestrian’s, or nearby property owner’s perspective. Diagrams can show drainage paths, utility upgrades, or traffic circulation without requiring the audience to interpret engineering drawings.
Public-facing visuals should be honest and clear. They should avoid over-polishing the project in a way that creates unrealistic expectations. The goal is not to make a project look like marketing fiction. The goal is to help the public understand the design and the construction impact.
Austin Visuals’ work in architectural and construction animation reflects this same need. People understand projects better when they can see the future condition before the work begins.
Engineering Visualization for Safety and Training
Civil construction sites are dynamic. Equipment moves, traffic patterns change, utilities may be exposed, work zones shift, and crews must coordinate around public access. Visualization can support safety and training by showing site-specific risks before crews enter the field.
A 3D animation can show excavation zones, crane swing radius, haul routes, pedestrian barriers, traffic control, utility conflicts, confined access, and restricted areas. It can compare safe and unsafe actions or demonstrate how a work zone changes between phases. This makes training more practical because the visual is tied to the actual project environment.
Safety visualization can also help non-field stakeholders understand why certain controls are necessary. A lane closure, barrier, or access restriction may be unpopular, but when people see the hazard it manages, the decision becomes easier to explain.
For contractors, owners, and agencies, visual training materials can be reused in orientation, toolbox talks, pre-task planning, and stakeholder briefings. A short animated module can make a complex work zone easier to understand than a static traffic control plan alone.
From CAD, GIS, and Survey Data to Presentation Visuals
Many civil visualization projects begin with technical source materials. These may include CAD drawings, BIM models, GIS layers, survey files, drone footage, LiDAR scans, plan sheets, aerial images, site photos, schedules, and engineering notes. The visualization process turns those inputs into a model or animation that is easier for audiences to understand.
The level of detail depends on the use. A proposal visual may need to show the concept and phasing clearly. A public meeting visual may need recognizable surroundings and before-and-after comparisons. A contractor planning animation may need accurate work zones, staging, equipment access, and temporary conditions. The production team should match detail to purpose.
This is where technical and creative judgment meet. Too much detail can clutter the message. Too little detail can reduce credibility. The best engineering visualization preserves the information that matters while simplifying the parts that distract from the communication goal.
Austin Visuals’ article From CAD to Cinema: Engineering 3D Animation Explained gives useful context on how technical files can become polished visuals for presentations, training, and stakeholder communication.
Best Practices for Civil Project Visualization
Strong civil project visualization starts with a clear audience. A city council presentation, contractor coordination meeting, public outreach event, investor pitch, and safety training session all require different visuals. The team should decide who needs to understand the project and what action or decision the visual should support.
Accuracy also matters. Civil projects involve real sites, real constraints, and public trust. Visuals should be built from reliable references and reviewed by the right stakeholders. Engineers should review design accuracy. Contractors may review constructability and phasing. Public communication teams may review clarity and tone.
Use labels and graphics carefully. Visual overlays can help explain traffic, drainage, utilities, access, or phasing, but too many labels can overwhelm the viewer. In many cases, it is better to show one idea at a time: existing condition, proposed improvement, construction phase, final result, or key risk.
Finally, plan for reuse. A 3D site model can support proposal visuals, stakeholder videos, renderings, phasing animation, safety training, and social clips. When the project team knows future uses early, the visualization can be structured to create more value.
FAQ: Engineering Visualization for Civil Projects
What is engineering visualization for civil projects?
It is the use of 3D models, animation, renderings, diagrams, and visual storytelling to explain civil engineering designs, infrastructure plans, construction phasing, and project impacts.
Which civil projects benefit from visualization?
Roadways, bridges, utilities, drainage systems, transit projects, airports, public facilities, site development, water infrastructure, and construction staging plans can all benefit from visualization.
Can visualization help win infrastructure proposals?
Yes. Proposal visuals can help evaluators understand project approach, phasing, site constraints, constructability, traffic management, and the final benefit of the proposed solution.
Is 3D visualization useful for public meetings?
Yes. Public-facing visuals can show before-and-after conditions, traffic changes, construction impacts, pedestrian access, drainage improvements, and final project appearance in a clearer way than plan sheets alone.
What materials are needed to start?
Useful materials include CAD drawings, GIS data, survey files, drone imagery, site photos, plan sheets, schedules, traffic plans, utility references, and project communication goals.
Can visualization show construction phases?
Yes. 3D sequencing animation can show demolition, staging, detours, temporary access, utility relocation, structural work, pavement, drainage, landscaping, and final conditions.
Can Austin Visuals work with engineering files?
Yes. Austin Visuals can work from CAD, drawings, images, maps, schedules, and engineering notes to create visualizations, animations, and presentation assets for civil projects.
Related Austin Visuals Posts
- How 3D Animation Wins Government Contracts in 2025
- Architectural & Construction Animation: Visualizing Projects Before the First Brick
- The Importance of Engineering-Grade 3D Visualization in Modern Industry
- From CAD to Cinema: Engineering 3D Animation Explained
- How Austin Visuals Transforms Ideas into 3D Renderings
Conclusion
Engineering visualization for civil projects helps teams explain infrastructure before it is built. It can show design intent, site context, construction phasing, public impact, safety conditions, and final outcomes in a way that drawings alone may not communicate to every audience.
For civil engineers, agencies, contractors, developers, and proposal teams, visualization can support better decisions and clearer conversations. It can help evaluators understand an approach, help the public understand what will change, help crews understand phasing, and help leaders communicate project value.
When civil projects are complex, visual communication becomes a practical tool for alignment. Austin Visuals helps turn technical files and project plans into clear visuals that make infrastructure easier to understand.
Austin Visuals helps companies turn equipment, workflows, safety procedures, products, and technical processes into clear visual content that teams and customers can understand.
Contact us at info@austinvisuals.com or call (512) 591-8024.